Update: 22 December 2024
Example hTMA
The hTMA lab report provides comprehensive information about your metabolic state, endrocrine system function, and toxic body-burden (i.e., the levels and interrelationship ratios of essential nutrient minerals and toxic elements).
hTMA Results Focus on 4 Key Areas
Top1. Toxic Elements
The toxic elements graph displays the results for each of the reported toxic elements. It is preferable that all levels be as low as possible and within the lower white section. Any test result that falls within the upper dark red areas should be considered as statistically significant, but not necessarily clinically significant. Further investigation may then be warranted to determine the possibility of actual clinical significance. The toxic minerals (heavy metals) are well-known for their interference upon normal biochemical function. These toxins are commonly found in the environment and therefore are present to some degree in all biological systems. However, these metals clearly pose a concern for toxicity when tissue accumulation occurs to excess.
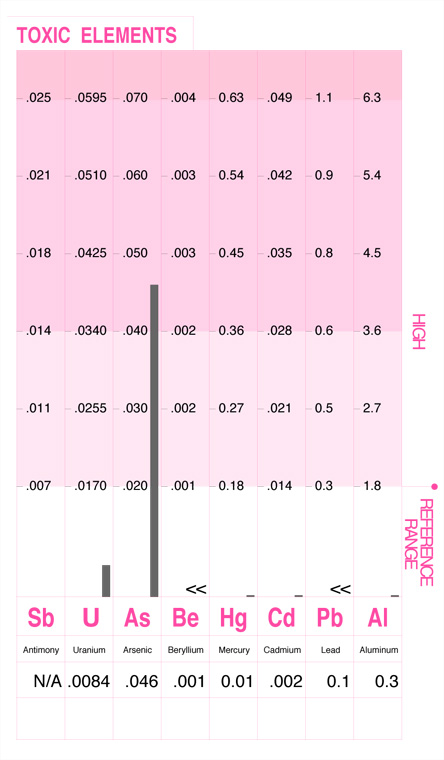
Toxic Elements. Arsenic is public enemy number one on ATSDR's Priority List of Hazardous Substances list. Arsenic is a known carcinogen and affects the skin, digestive system, liver, nervous system and respiratory system. Arsenic compounds can create reactions in the body that disrupt enzymes that are involved in respiration of cells, fat and carbohydrate breakdown and their metabolism. The accumulation of toxic levels of arsenic can result in paralysis, coma, cardiovascular collapse and death.
In the quest to improve production, industrial agriculture (e.g., C.A.F.O.) actually puts arsenic in the feed for pigs and poultry. And in the case of swine, to treat diarrhea. This meat is then used in commercial food products. Also, arsenic can be found in many commonly used products including fungicides, pesticides, herbicides, laundry products, cigarette smoke, paints, and wood preservatives. Global industries such as mining and smelting, chemical and glass manufacturing produce arsenic as a by-product. This in turn finds its way into our water supplies and food sources.
Top2. Toxic Ratios
This section displays the relationships between the important nutritional elements and toxic metals. Each toxic metal ratio result should be in the upper white area of the graph, and the higher the better. Toxic ratios that fall within the darker red area may indicate an interference of that toxic metal upon the utilization of the nutritional element.
Every person is exposed to toxic metals to some degree. The retention of these toxic metals, however, is dependent upon the individual's susceptibility. The balance of the protective nutrient minerals within the body in relation to the heavy metals can frequently be the determining factor to this susceptibility. As an example, the accumulation of lead will have a more detrimental effect upon body chemistry when sufficient levels of calcium and iron are not available. By examining the toxic metal levels in relation to the protective minerals, the extent to which the heavy metals may be involved in abnormal chemistry can frequently be seen. This is done by examining the toxic ratios.
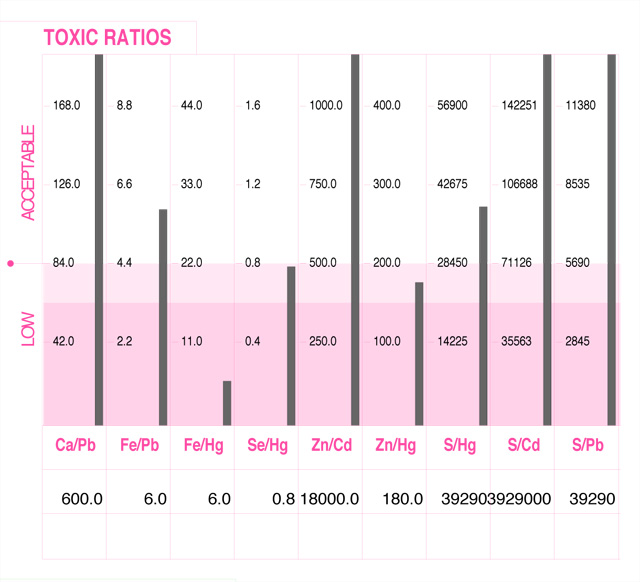
Toxic Ratios. This chart shows both a low Fe/Hg and a low Zn/Hg level. When iron and zinc levels within the body are sufficient, these nutrient minerals are able to produce an antagonistic or protective response to the adverse affects of mercury. However, when iron or zinc are low in relation to mercury, their protective action upon mercury may become markedly reduced.
Top3. Nutritional Elements
Extensively studied, the nutrient minerals have been well defined and are considered essential for many biological functions. They play key roles in such metabolic processes as muscular activity, endocrine function, reproduction, skeletal integrity and overall development. This section of the report shows nutritional mineral levels that may reveal moderate or significant deviations from normal. The white area of the graph's mineral levels represent the established reference ranges as determined from statistical analysis of healthy people. A mineral level that is outside the reference range can be identified.
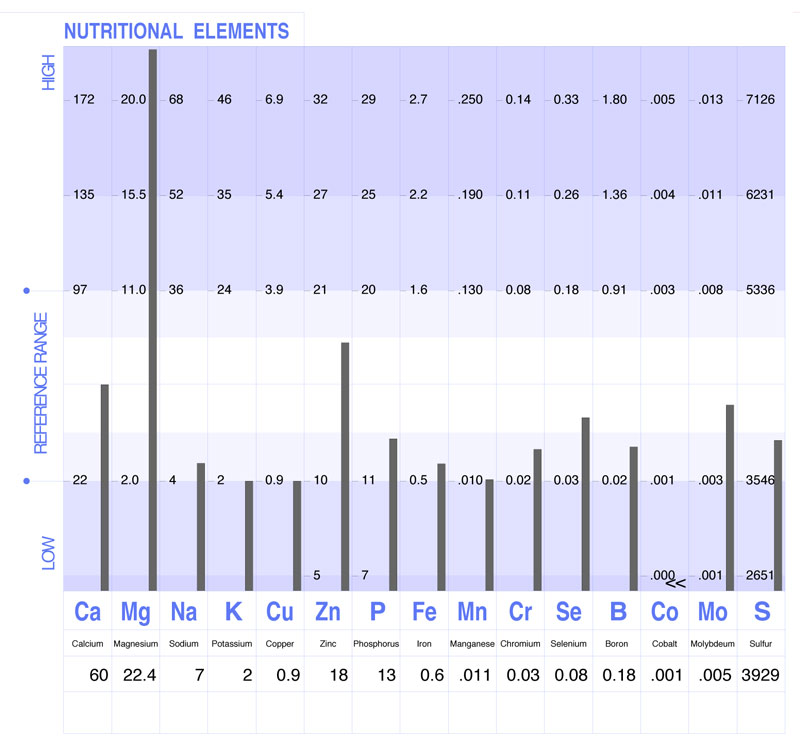
Nutritional Elements. This graph shows excess magnesium. Magnesium is the fourth most abundant metal found in the body, and is essential for muscle relaxation, protein synthesis, nerve excitability and energy production on a cellular level. However, magnesium also has a sedating effect upon the body, and when in excess may contribute to a number of conditions, such as; low blood pressure, depression, fatigue, dizziness, craving for salt, muscle weakness, decreased mental alertness, lowered body temperature.
Top4. Significant Ratios
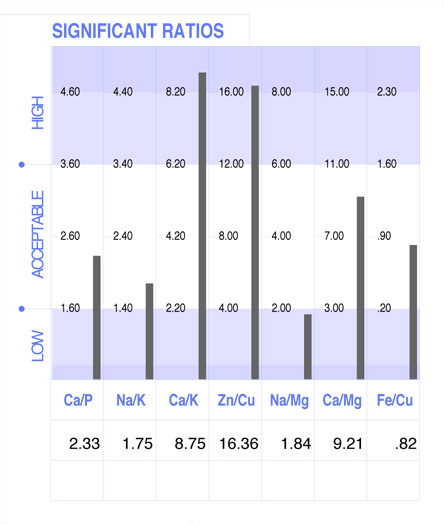
Significant Ratios. This graph shows a high Ca/K ratio. High calcium relative to potassium will frequently indicate a trend toward hypothyroidism (under-active thyroid). The mineral calcium antagonizes the retention of potassium within the cell. Since potassium is necessary in sufficient quantity to sensitize the tissues to the effects of thyroid hormones, a high Ca/K ratio would suggest reduced thyroid function and/or cellular response to thyroxine. If this imbalance has been present for an extended period of time, the following symptoms associated with low thyroid function may occur; fatigue, depression, dry skin, over-weight tendencies, constipation, cold sensitivity.
The significant ratios section displays the important nutritional mineral relationships. Mineral relationships (balance) is as important, if not more so, than the individual mineral levels. The ratios reflect the critical balance that must be constantly maintained between the minerals in the body for healthy metabolic function and optimal cellular energy production.
Continuing research indicates that metabolic dysfunctions occur not necessarily as a result of a deficiency or excess of a particular mineral level, but more frequently from an abnormal balance (ratio) between the minerals. Due to this complex interrelationship between the minerals, it is extremely important that imbalances be determined. Once these imbalances are identified, corrective therapy may then be used to help re-establish a more normal biochemical balance.
hTMA Plus Extras
With hTMA Plus, in addition to the lab report explained above, we include review and interpretation of your hTMA by a hTMA clinician and a medical evaluation (as your test results relate to your health profile). Consultation also is included to discuss your results and questions (1-hour). hTMA Plus extra documentation helps clarify the lab data making it easier for you to get the most benefit from your results.
Extra Documentation
- Ideal Levels Comparison. See how your levels compare with healthy levels.
- Endocrine Index. Understand your ability to produce cellular energy, and how capable your immune-system is.
- Performance Index. See how your adrenal and thyroid glands impact your speed and endurance.
- Supplement Schedule. An organized easy-to-use daily supplement chart.
- Food Recommendations Chart. A conscise reference of ideal foods (and those to avoid).